Industry
Technology
Organization Size
Corporation (10,000+ employees)
Country/region
United States
Technology
Company
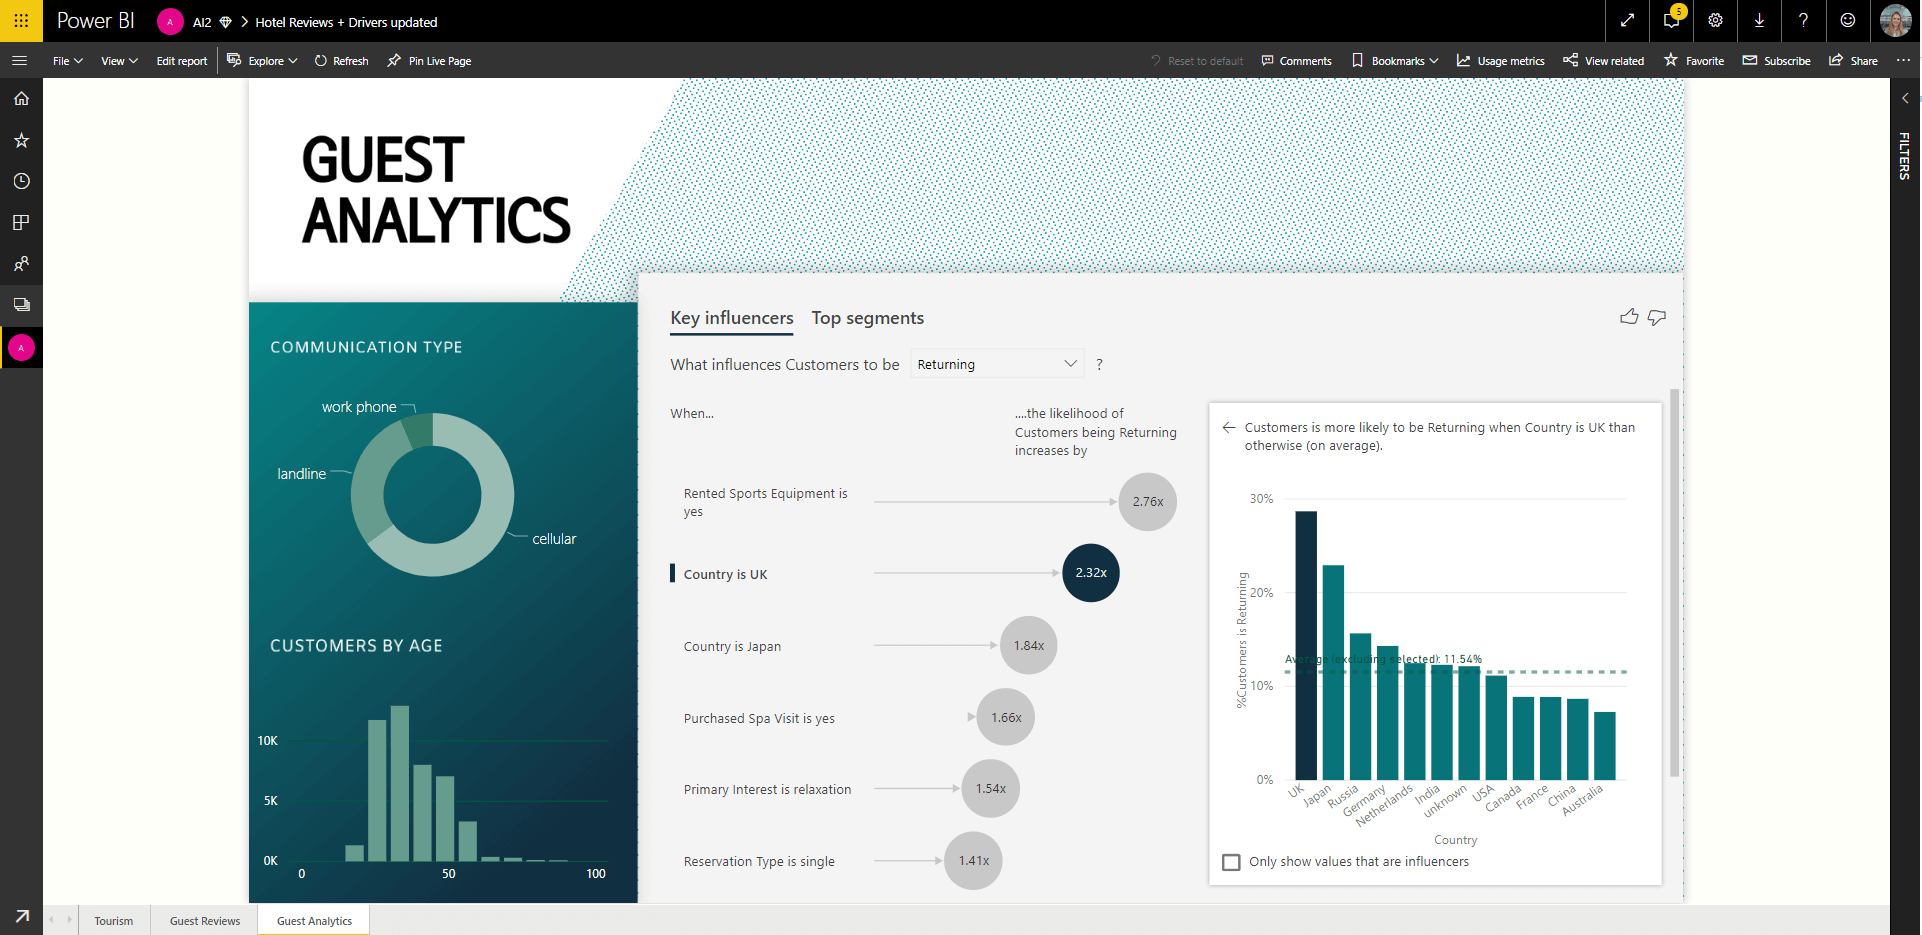
Power BI is a business analytics solution developed by Microsoft that allows users to visualize their data and to share insights across their organizations or embed them in their apps. Power BI provides a variety of visualizations, such as charts, graphs, and gauges, to help users create reports from their data. Recently, Power BI has been utilizing machine learning to simplify complex tasks for their users in order to empower everyone in organizations to harness the power of AI to make better decisions. In February 2019, Power BI previewed its first AI-powered visualization, Key Influencers, which uses ML.NET behind the scenes to reason over data and surface insights in a natural way.]
Business Problem
For any business, identifying and understanding key influencers (the main drivers for business performance and outcomes) and customer segments is critical for making strategic business decisions, prioritizing changes to the business, and gaining competitive advantage. Analyzing key influencers can reveal which factors have the biggest impact on business performance and can help a business answer questions such as "which factors lead customers to leave negative reviews about this service?" or "what influences house prices to increase?"
However, this process of data analysis for key influencers and customer segmentation takes a lot of time, effort, and expertise; it often involves coding multiple functions, sampling, significance tests, and ranking results. Thus, Power BI turned to a machine learning solution so that they could enable their users to speed up the process of gaining meaningful insights and to be able to do statistical analysis without having to spend time writing complex code.
Key Influencers and ML.NET
Power BI created the Key Influencers visualization as a machine learning solution to allow businesses to leverage AI so that they can analyze their data in less time and make key business decisions faster. In other words, users can use Key Influencers to spend less time analyzing data and spend more time acting on the insights gathered from the AI visualization.
Once a user picks a key performance indicator (KPI) to analyze (for example, retention rate, click-through rate, and so on), the Key Influencers visualization uses machine learning algorithms provided by ML.NET to figure out what matters the most in driving metrics, as well as to find interesting segments for further investigation. Key Influencers analyzes a user's data, ranks the factors that matter, contrasts the relative importance of these factors, and displays them as key influencers and top segments for both categorical and numeric metrics.
Solution architecture
Power BI is shipped in multiple forms. The Key Influencers visualization is supported in the mobile, desktop, shared service, and premium service forms.
When a user adds columns to the Key Influencer visual, a flow is triggered in which training data is sent to Analysis Services (the database engine behind Power BI). Analysis Services runs ML.NET to train machine learning models, and results are returned. Thus, the model is trained whenever a user updates selected features. The overall goal is to perform the analysis in a few seconds, enabling an interactive experience.
The overall flow is shown below:

ML.NET is consumed as a .NET Framework library and runs either on-premises (if used in Power BI Desktop) or in the cloud (if used in the Power BI service). Datasets in Power BI are stored in a binary format native to Analysis Services.
Categorical key influencers
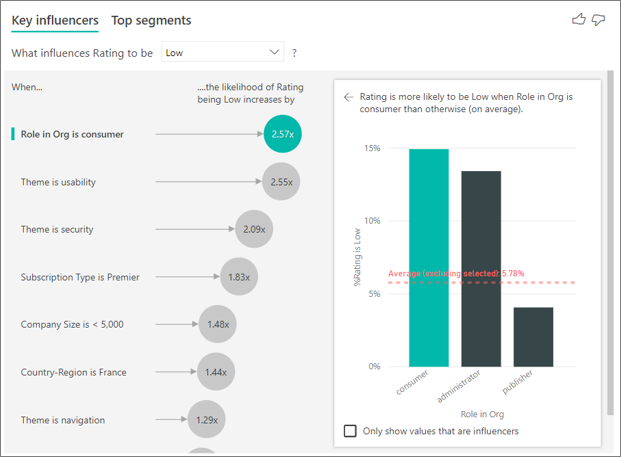
Categorical metrics can include things like ratings or rankings. In the example below, the metric is Rating, and the visualization has determined that Role in Org is consumer is the top single factor that influences the likelihood of a low rating. The visualization displays additional information in the right pane, such as:
- 14.93% of consumers give a low score.
- On average, all other roles give a low score 5.78% of the time.
- Consumers are 2.57 times more likely to give a low score compared to all other roles.

Key Influencers uses ML.NET to run logistic regression for categorical metrics, using the One-hot encoding, Replace missing value, and Normalize mean variance data transformations and the L-BFGS Logistic Regression algorithm. In this case, the algorithm searches for patterns in the data and looks for how customers who gave a low rating might differ from the customers who gave a high rating. It might find, for example, that customers with more support tickets give a higher percentage of low ratings than customers with few or no support tickets.
Numeric key influencers
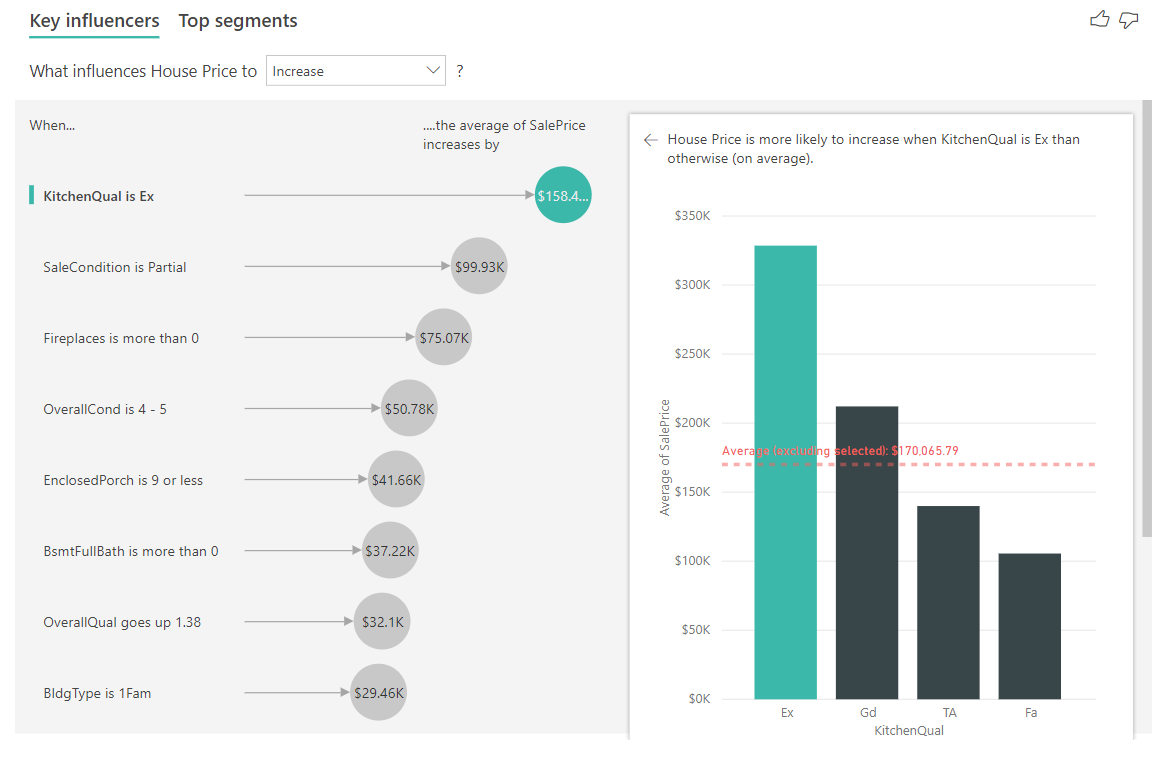
Numeric metrics can include things like price or sales numbers. In the example below, the metric is House Price, and the visualization has determined that Kitchen Quality is Excellent is the top single factor that influences the likelihood of an increase in house price.

Key Influencers uses ML.NET to run linear regression, using the same data transformations as the categorical key influencers and using the SDCA regression algorithm. In this case, the algorithm looks at how the house price changes based on explanatory factors, such as number of bedrooms or square footage. In this case, it looks at the impact having an excellent kitchen will have on the house price.
Calculating top segments
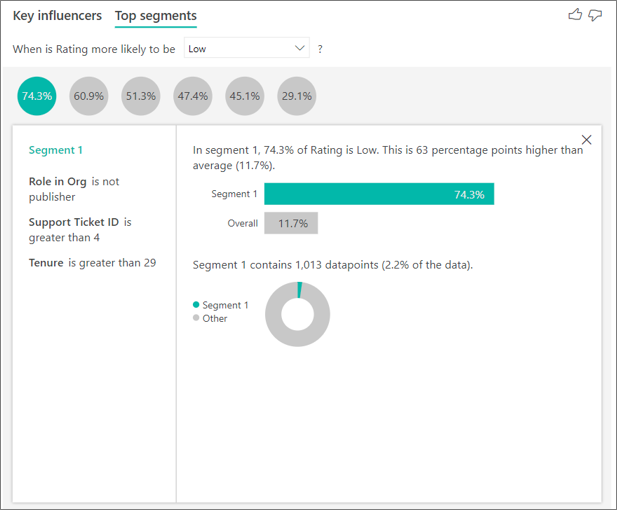
Top Segments shows the top groups that contribute to the selected metric value. A segment is made up of a combination of values. For example, the segment below is people who are consumers or administrators, who have greater than 4 support tickets, and who have been customers for over 29 months. 74.3% of the customers in this segment gave a low rating, compared to the average customer, which gave a low rating 11.7% of the time.

Top Segments uses ML.NET to run a decision tree, using Fast tree algorithms (categorical and numerical), to find interesting subgroups. The objective is to end up with a subgroup of data points that's relatively high in the metric of interest. This could be customers with low ratings or houses with high prices.
The algorithm takes each explanatory factor and tries to reason which factor gives it the best split. After the decision tree does a split, it takes the subgroup of data and determines the next best split for that data. In this case, the subgroup is customers who commented on security. After each split, it also considers whether it has enough data points for this group to be representative enough to infer a pattern from or whether it's an anomaly in the data and not a real segment. After the decision tree finishes running, it takes all the splits, such as security comments and large enterprise, and creates segments.
Power BI uses ML.NET to help their customers easily identify key influencers in their businesses, saving them time and effort and allowing them to focus on making changes and business decisions based on analytics and insights produced from the ML.NET models.
